Facebook and Instagram are the most popular social networks among marketers. For a good reason – both networks are highly-visual and engaging, and ad placement and branding opportunities are abundant.
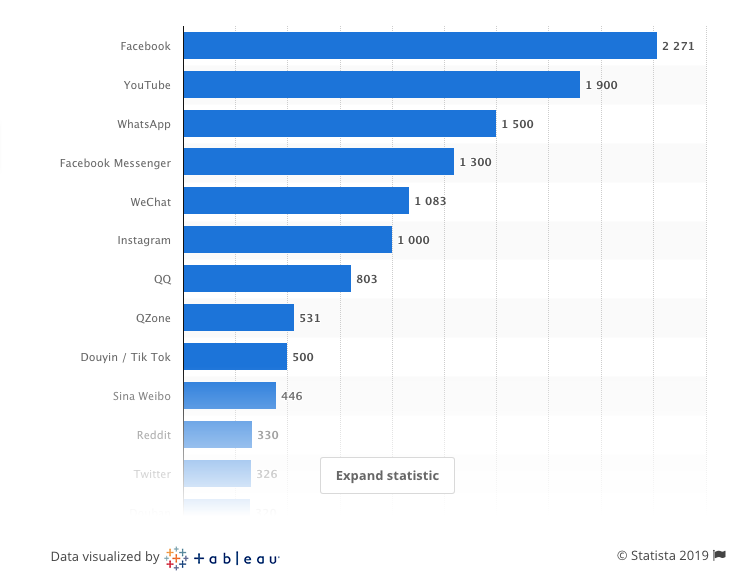
Facebook is the most popular social network in the world, Statista confirmed in its January 2019 report. It currently has 2.27 billion monthly active users. Second place is held by YouTube, and if we exclude messaging apps, Instagram comes third, with 1 billion monthly active users.
So, it’s clear, Facebook and Instagram are the places where the party (and potential customers) are. For marketers, this comes with an ever-growing price tag. So, if your budget is limited, or you simply want to make sure you get the best result, which one should you pick?
Let’s find out in this ultimate Facebook vs Instagram showdown.
Facebook vs Instagram – Model
By its nature, Facebook offers more opportunities than Instagram. You can run advertisements in the form of content, images, videos, and multimedia carousels. Placement options are also abundant – your advertisement can be displayed in 13 different places, including feed, right column, in-stream videos, marketplace, stories and Facebook Messenger.
You can take a deeper look into the most effective Facebook ad types here. Facebook advertising model makes it fairly simple even for marketing beginners to advertise. With the right knowledge about targeting and segmentation, the ad campaign setup is fairly simple. You can pick target audiences based on their gender, age, location, behaviors and interests.
Instagram’s interface may be much simpler than that of Facebook, but it still offers enough effective opportunities for advertising.
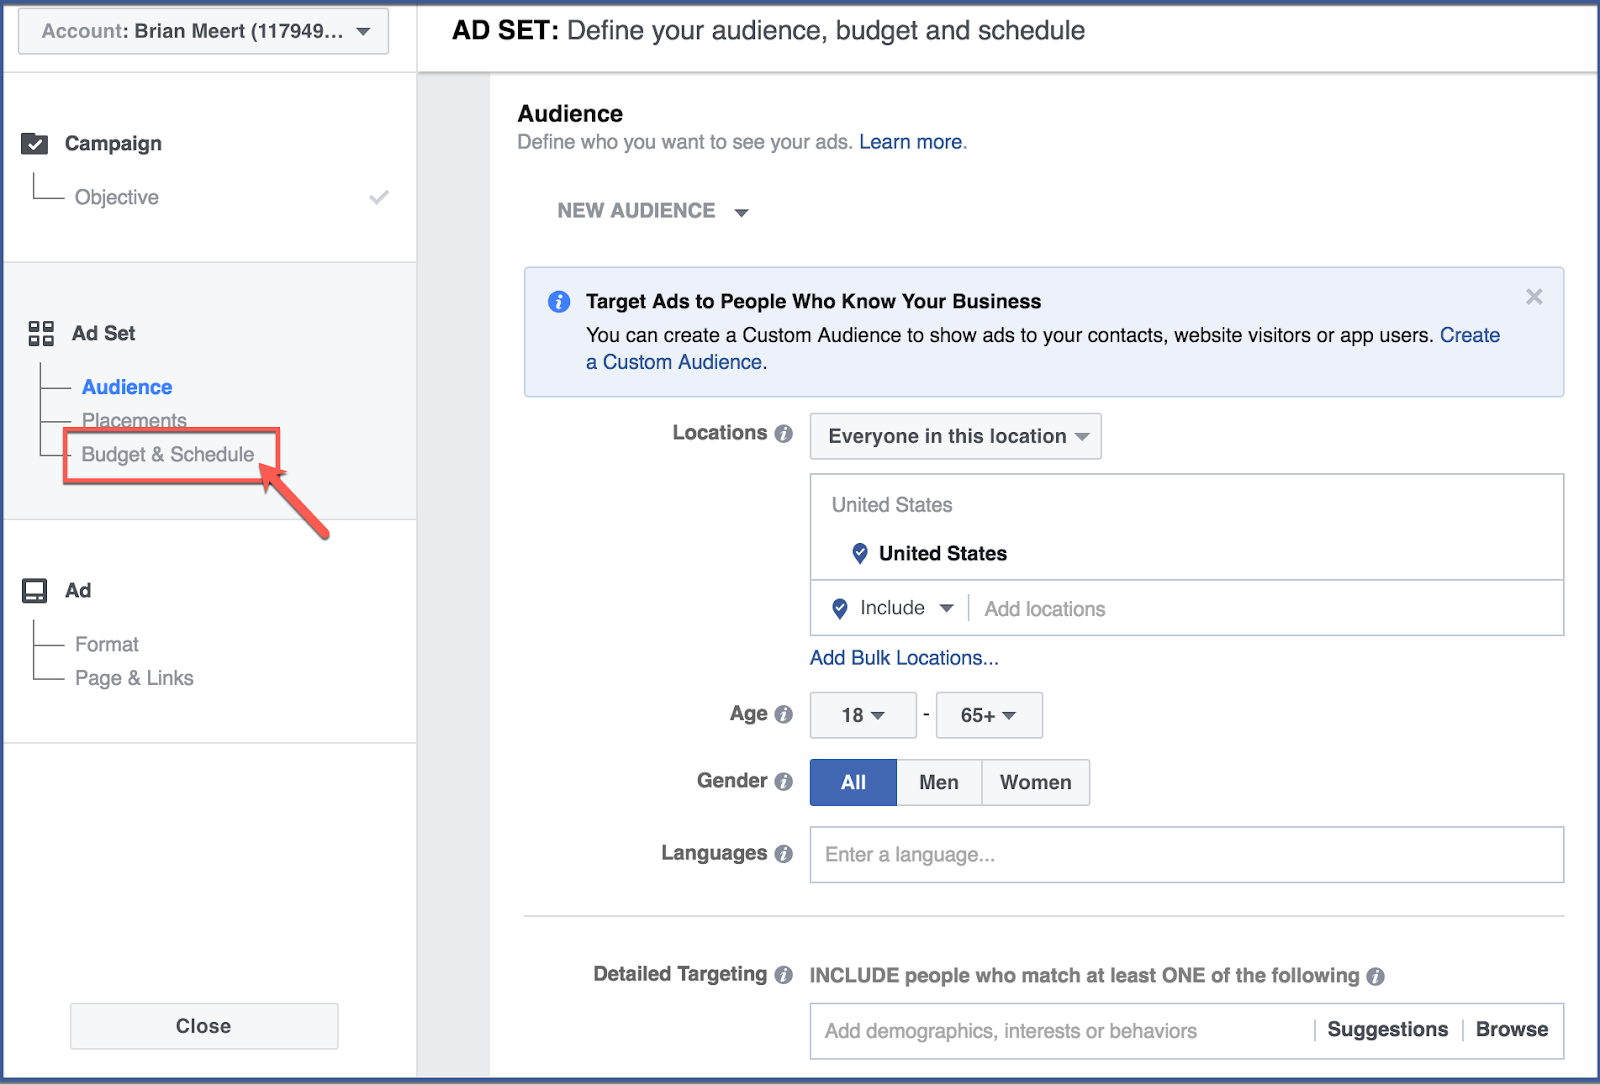
Instagram offers photo, video, carousel, collection ads you can place within the regular or stories feed. Since Instagram is part of Facebook advertising platform, the setup is similar to campaigns on Facebook.
You can opt for automated targeting, custom or lookalike audience, and you can set audience for your campaigns based on their location, demographics, interests, and behaviors.
Here’s a quick overview of using Instagram marketing and of setting up a campaign on Instagram. You start off with defining your marketing objective.
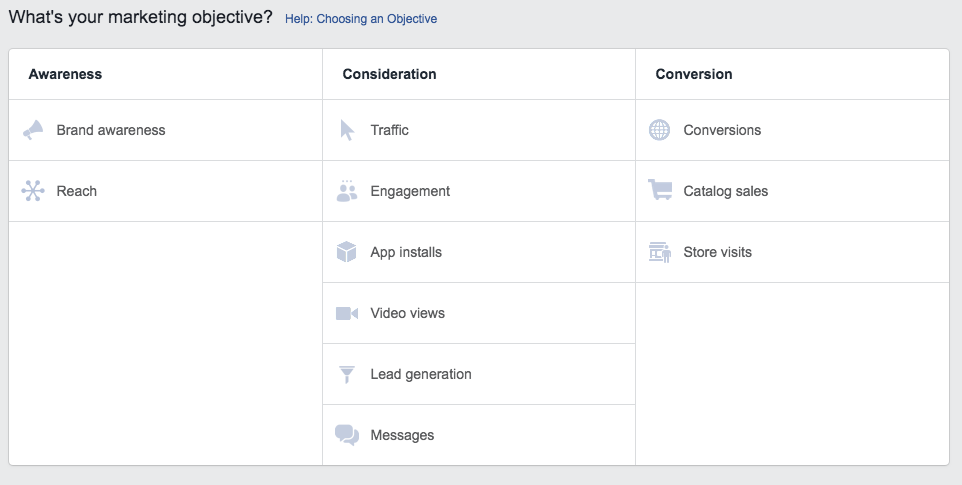
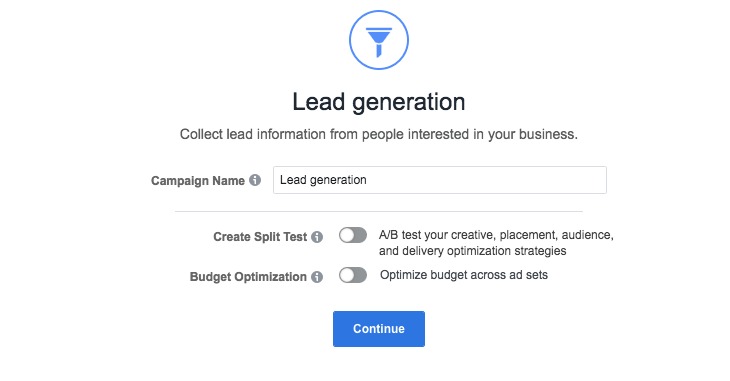
For example, you can pick lead generation. After you opt for a marketing goal, you have additional options to optimize your budget or create split tests.
A basic marketing opportunity analysis and creating a buyer persona well be a solid foundation for a any marketing campaign on Facebook or Instagram.
WHen it comes to advertising model, and simplicity of a campaign setup, Facebook and Instagram are equal – but let’s see how much this simplicity costs.
Facebook vs Instagram – Price
The price of advertising on Facebook depends on many factors – ad type, advertising goal, the industry, and finally, the amount of competition you get from other advertisers for a certain target audience.
The larger the audience, the higher the cost. Same goes for advertising goals – the closer the goal is to sale, the higher the price. So, you bid the amount you are ready to spend for an impression, click, video view or app installation.
The most common pricing model among marketers is pay-per-click, and its average cost on Facebook is $1.72. This number varies greatly across the industries.
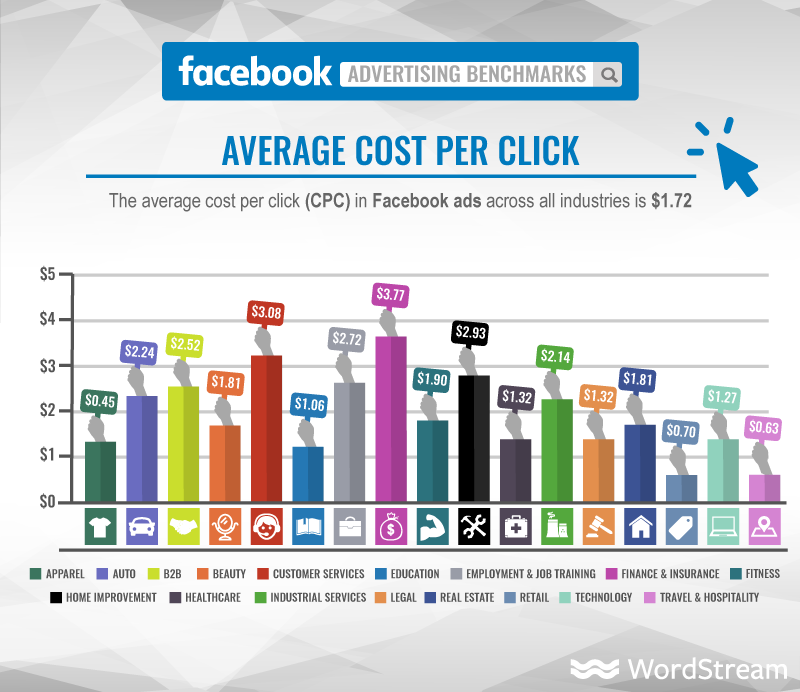
Apart from cost-per-click model, Facebook can also charge you per mile (CPM – 1000 impressions) and per action (CPA – cost per action) as well, with average price of $2.29 and $18.68 respectively.
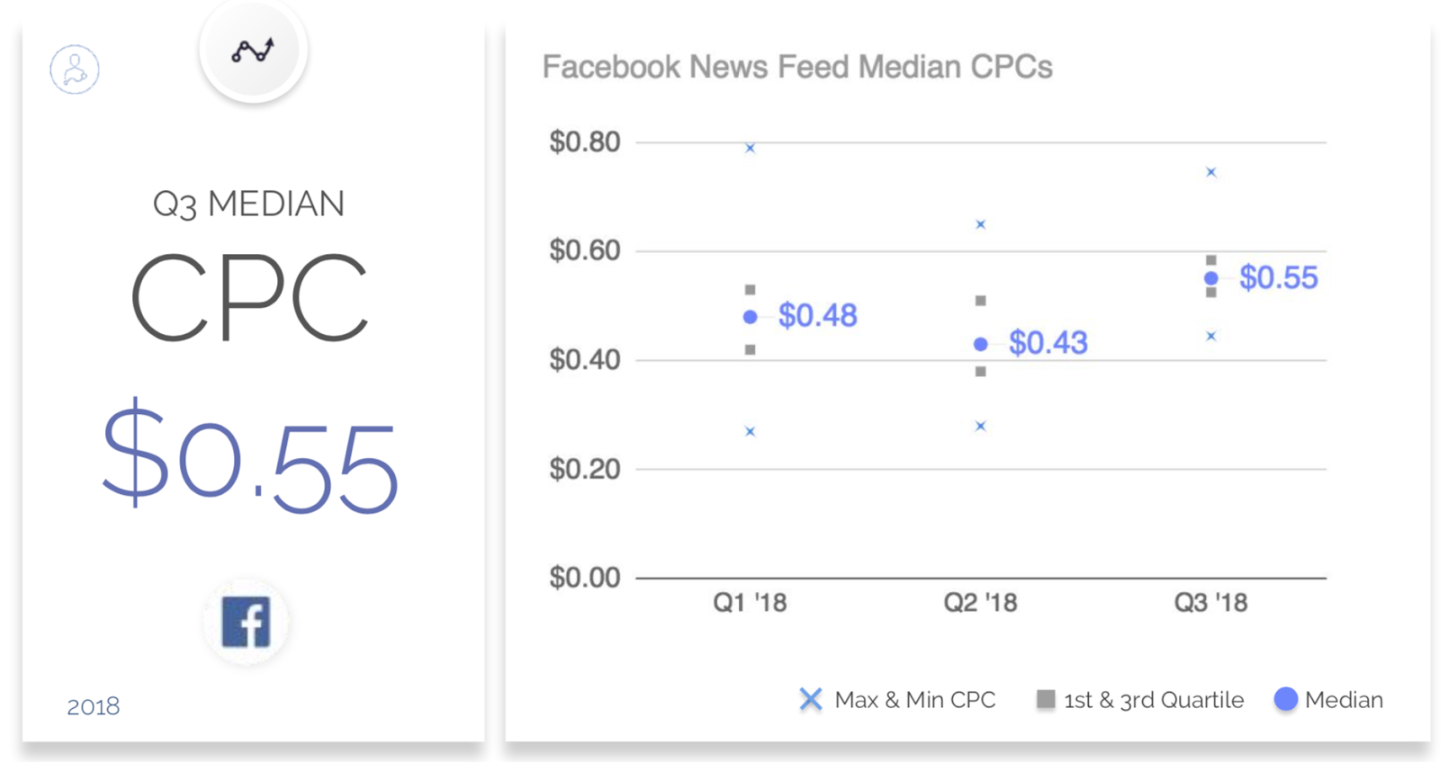
However, let’s look beyond WordStream’s report that dabbles in *average* numbers. Average numbers can often skew statistics and not really give you sense of the most common amounts marketers pay per clicks or impressions.
For example, AdStage reports deal with median numbers – which is the middle value in the data set. Based on over 3 billion ad impressions and nearly 44 million clicks in late 2018, median CPC on Facebook was $0.55, while median CPM was $8.20.
Once again, since Instagram ads are part of the Facebook advertising network, their pricing model follows the same bidding system you can find on Facebook. As you could see when we presented the advertising model of Instagram, advertising objectives are split into three categories – awareness, consideration and conversion, all of which branch into more specific objectives such as reach, clicks, views, installs, etc.
This, in turn means that the price of Instagram ad can also vary greatly based on your industry, target, audience, objectives and competition from the other advertisers.
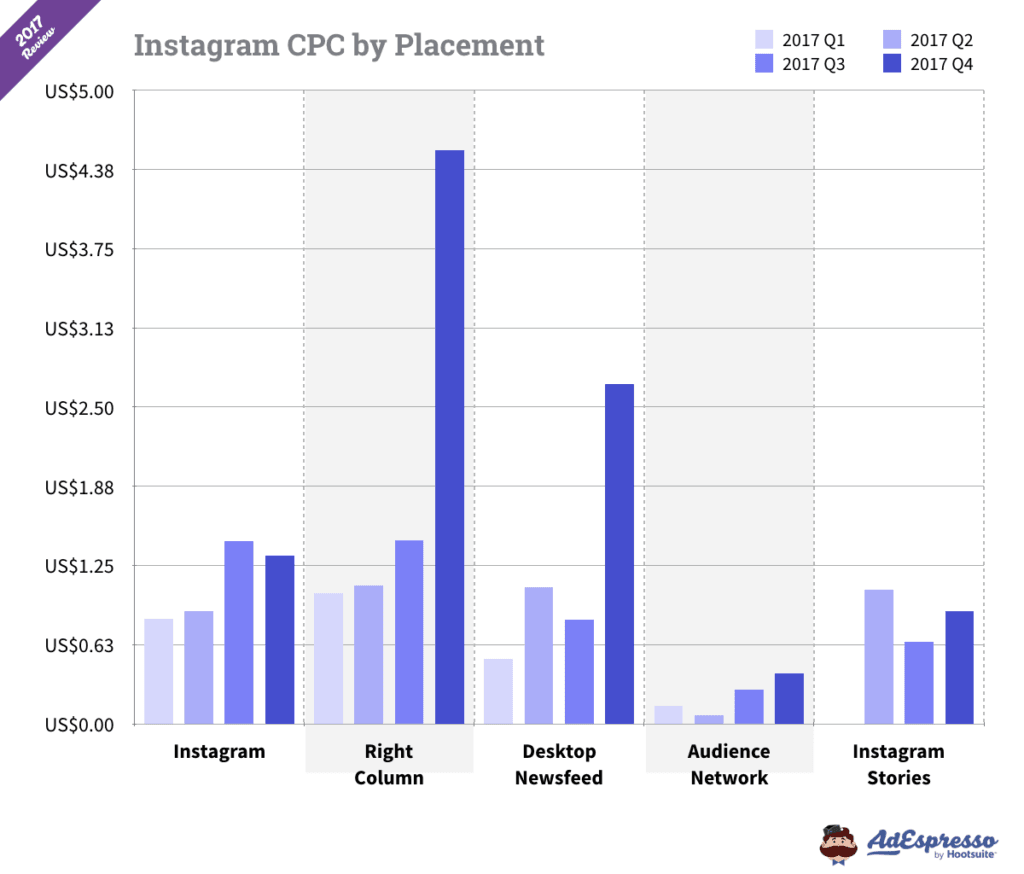
AdEspresso’s detailed report from 2017 shows great variations in these prices based on age, gender and even devices of targeted users. Also, it has shown that there has been a steady, yet continuous increase in price as the year went on.
Instagram CPC by country varied between $1.37 and $3.73, with Vietnam, Kenya and the United States among the priciest advertising locations.
The graph below went a step further and compared ad placement CPC within entire Facebook platform, so even though Instagram is on average more expensive than Facebook, the final price can also depend on ad placement and time of the year.
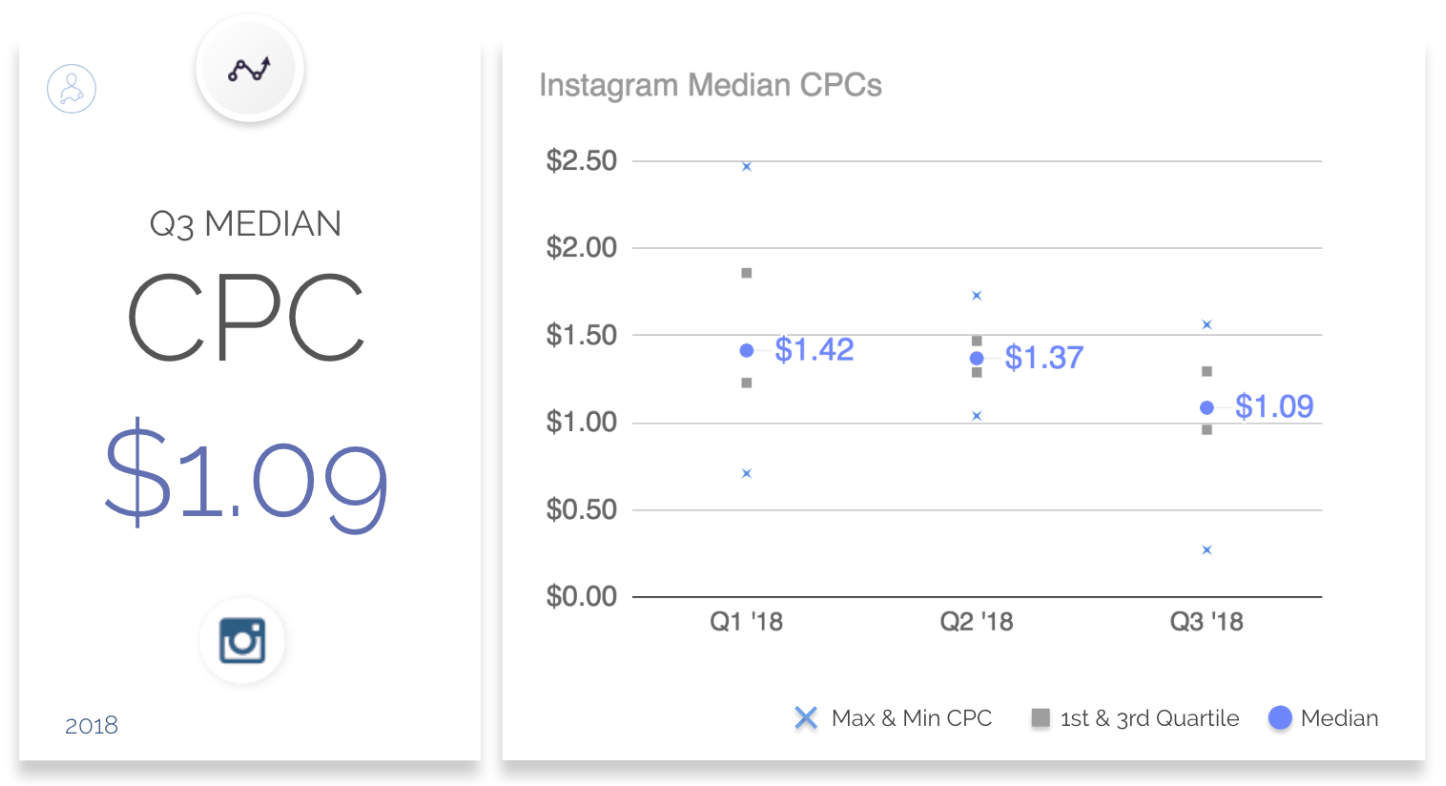
But what about median prices? Let’s turn to AdStage report one more time. In late 2018, Instagram’s CPC was $1.09, while median CPM was $6.90. So, despite Instagram’s popularity among marketers, AdStage concluded that the cost of Instagram advertising has plummeted compared to 2017 – which is good news.
So what’s the takeaway?
Instagram CPC is double the CPC of Facebook, even after the drop in prices, while CPM on Instagram is cheaper.
But before you bid your budget on Facebook, let’s see what you get in return for those 50 cents or one dollar.
Facebook vs Instagram – Reach, Clicks and Conversions
Reach
If we are talking about the sheer numbers of users, Facebook’s dominance is uncontested, with more than 2.1 billion members.
Around two-thirds of U.S. adults use Facebook, and around eight-in-ten young people aged 18-29 use Facebook. The share of people older than 65 has doubled in the last 6 years.
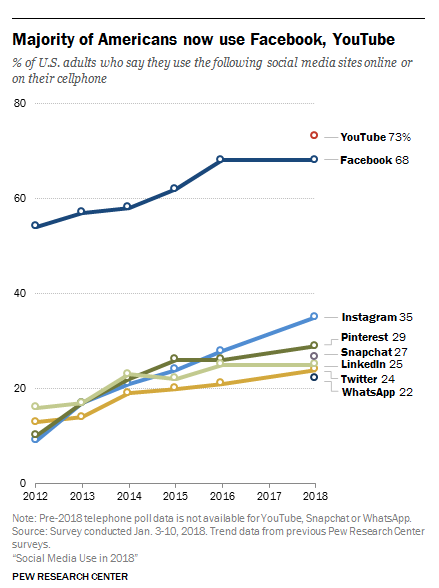
Roughly a third of U.S. adults is on Instagram, and the number of its users worldwide has reached one billion. More than half of the U.S. Instagram users are between 18 and 29 years old, while 33 percent of users are between 30- and 49-years-old. Women consist the majority of Instagram users, which conversely reflects on the aforementioned higher CPC for targeting female audience.
In terms of potential reach, Facebook is the winner. But what about engagement?
Engagement
If you want a detailed look into engagement rates, look no further than this report by RivalIQ, which compiled data from Facebook, Twitter and Instagram across 10 industries.
Across various industries, Instagram is the absolute winner when it comes to engagement, leaving other social media lagging miles behind. For example, in fashion industry, Facebook engagement rate is around 0.10%, while on Instagram, this number increases to 0.92%
Take a look at stats for Food and Beverages industry.
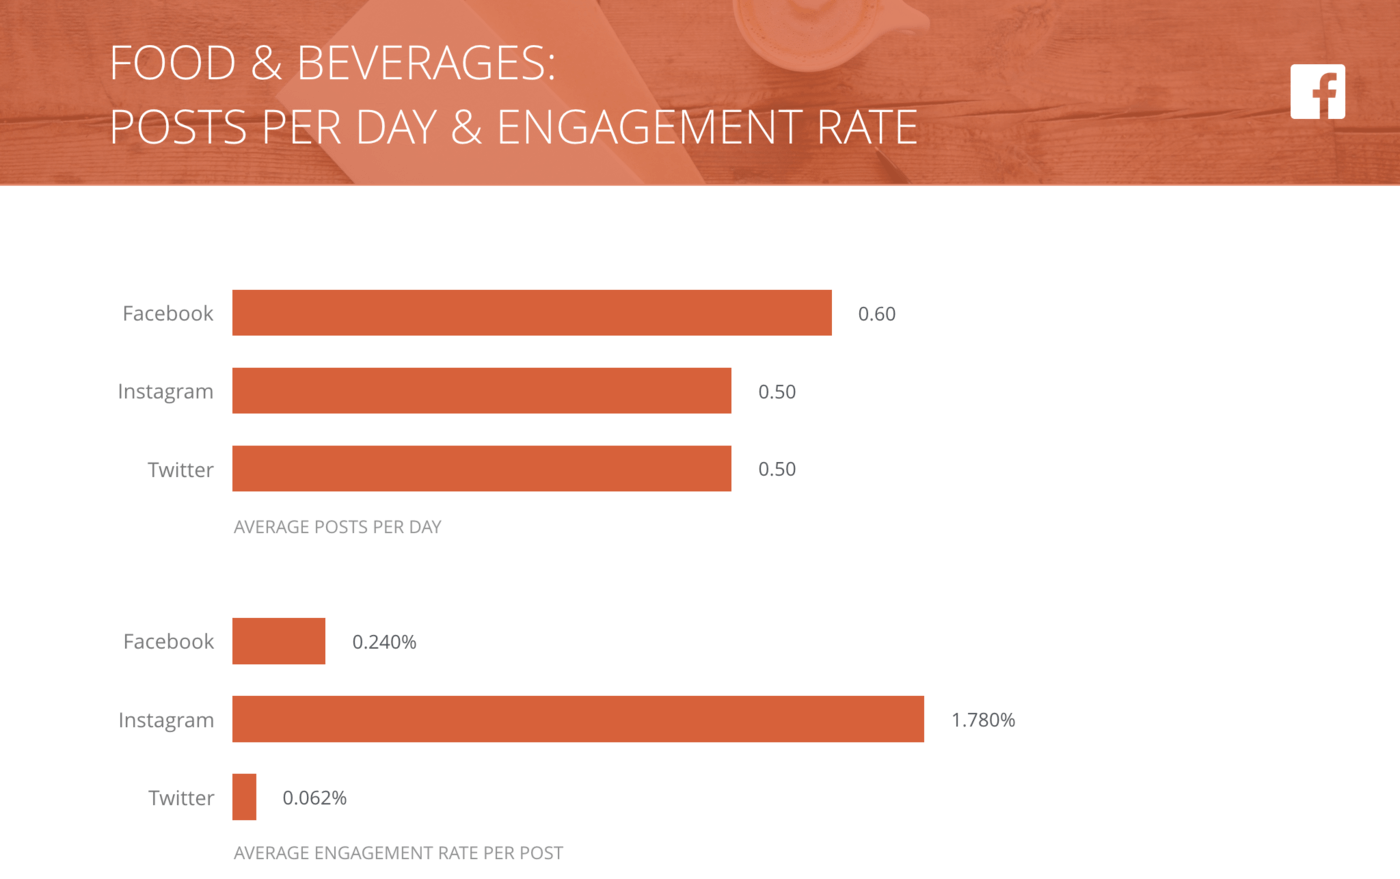
I encourage you to study the report in detail, because it provides valuable data for marketers. But the general takeaway? If branding is the ultimate goal of your marketing campaign, Instagram is the place to go.
Clicks
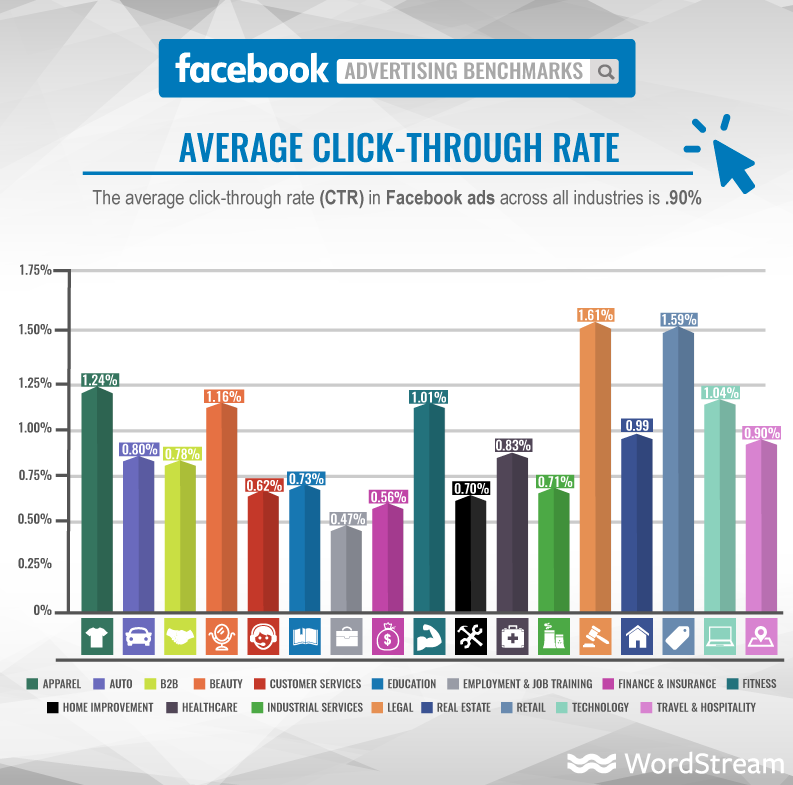
On Facebook, the average CTR across all industries is 0.90%, WordStream reported, but this number can vary. Take a look.
If we look into AdStage data for Q3 in 2018, median CTR for Facebook ads was 1.44% for news feed, 0.61% for messenger, and 1.37% for audience network ads.
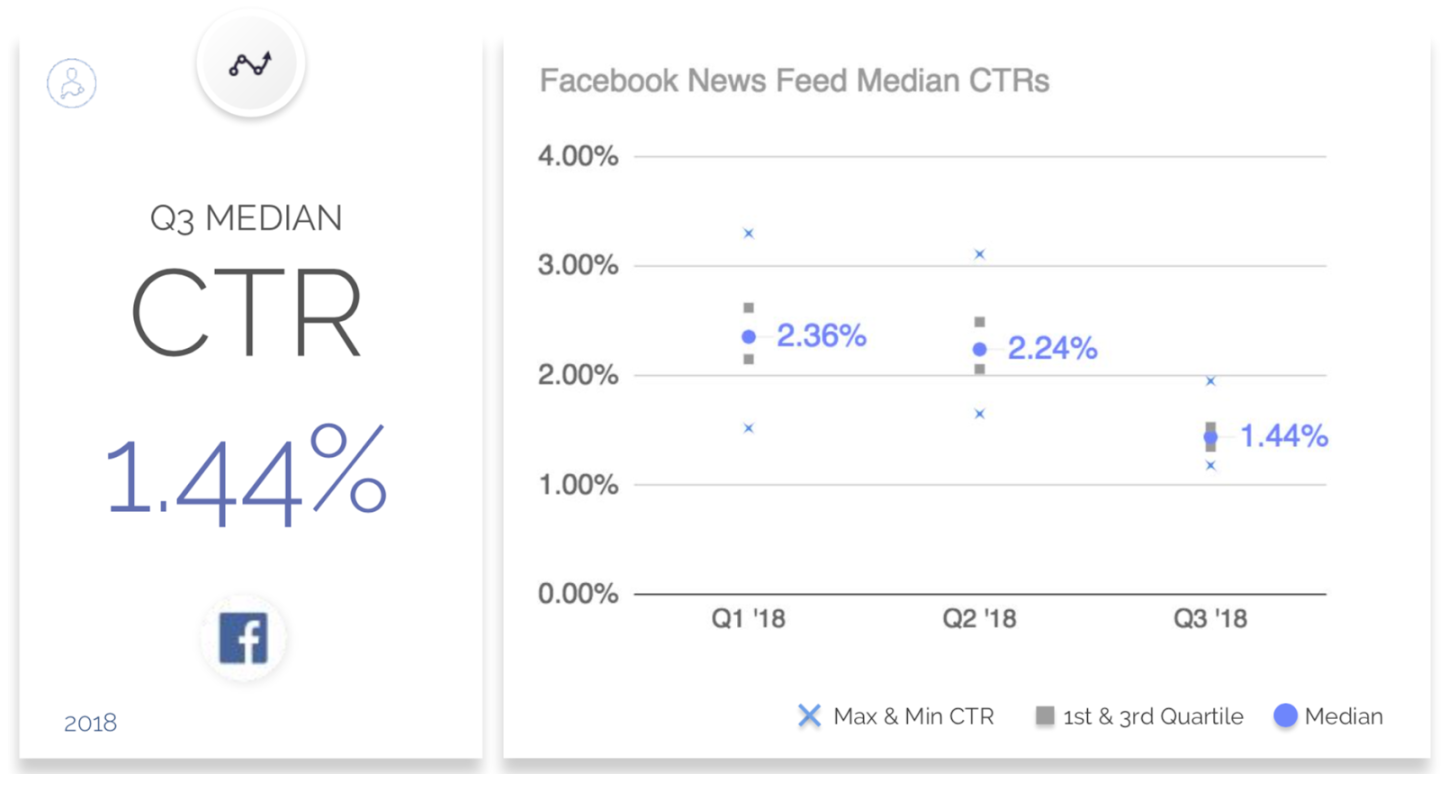
As you can notice, there has been a significant drop.
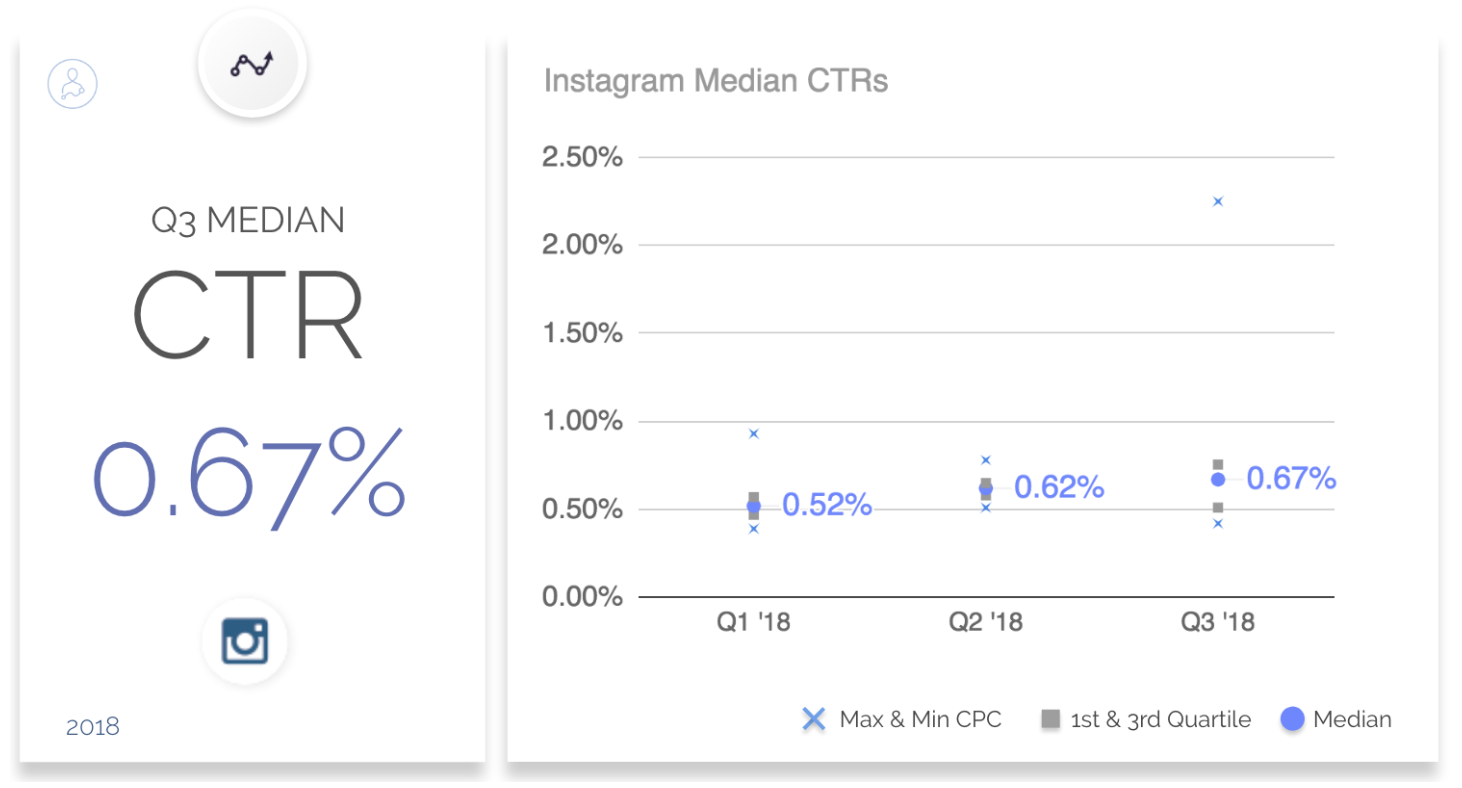
At the same time, median CTR for ads on Instagram has skyrocketed compared to last year, and has been increasing for the past two years. In late 2018, it was 0.67%.
Final verdict?
Facebook has higher median CTR, but while clicks on Facebook are dropping, on Instagram their number keeps growing.
Conversion rate
And finally, all marketing efforts come to naught if there are no sales. So, how do our two social media giants compare when it comes to getting people to purchase the goodies you offer them?
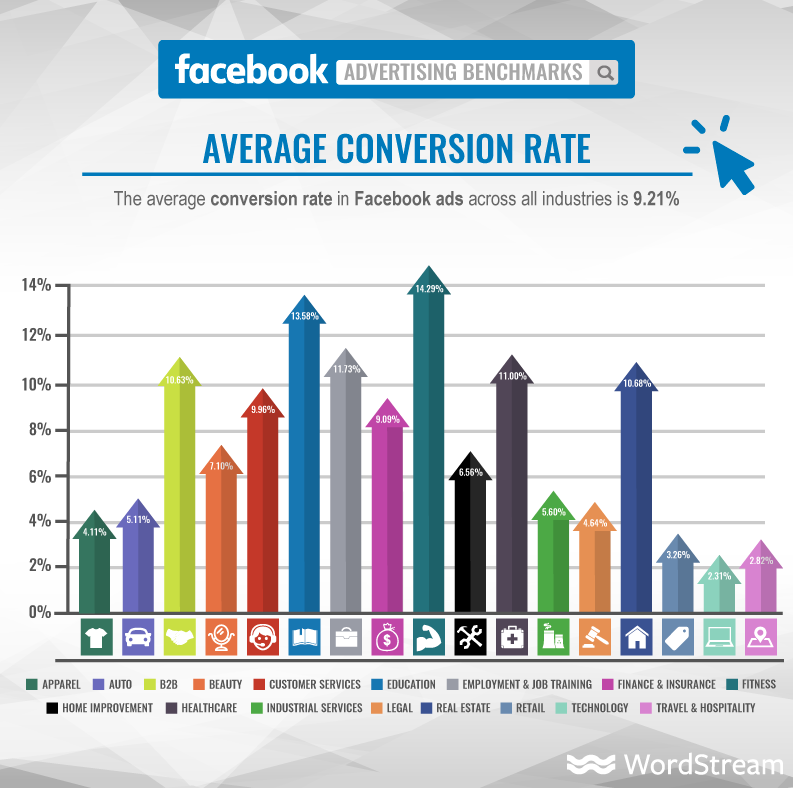
According to WordStream, the average conversion rate for Facebook ads is 9.21%, which is a fairly solid number.
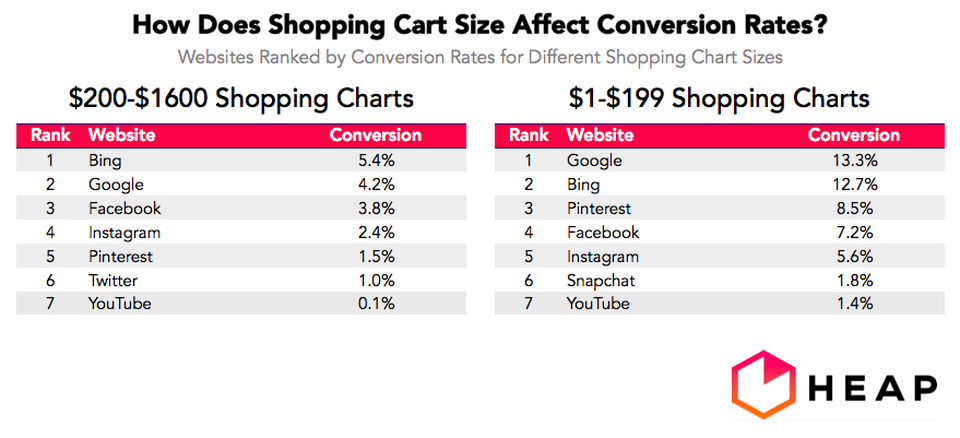
However,let’s look at some fresh information. An analytics company Heap conducted a customer acquisition research on several social networks and search engines. Once again, they come to a conclusion that conversion rates vary greatly based on the size of the customer’s shopping cart.
According to Heap, Google and Bing had the highest customer conversion rates, at around 8%.
Facebook conversion rate was 4.7%, while Instagram stood at 3.1%. Here’s a look at variations based on the amount of money spent by customers.
Facebook vs Instagram – Reliability
Finally, let’s talk about the reliability of the advertising system on Facebook and Instagram. While the question of occasional bugs and glitches doesn’t often get a lot of attention, it is actually of tremendous importance if you are running time sensitive campaigns that require constant monitoring.
In late October 2018, Facebook Ads Manager was down for 8 hours, giving a serious headache to marketers who handled midterm elections campaigns. The elections were only a week away, and marketers were left to their own devices to come up with a plan to track their clients’ performance.
Marketers complained that Facebook ad manager had become “an increasingly frustrating experience” due to repeated glitches and inconsistent auctions.
Since Instagram ads run on the same platform, marketers should be cautious with time sensitive campaigns and make sure they have an alternative way to handle these glitches.
Facebook vs Instagram – Final verdict
What does the final verdict say?
- Facebook has more ad placement opportunities
- Facebook and Instagram run on the same advertising platform and pricing model
- Median CPC on Facebook is $0.55, median CPC on Instagram is $1.09
- Median CPM on Facebook is $8.20, median CPM on Instagram is $6.90
- Facebook has a higher reach
- Instagram has a higher engagement
- Median CTR on Facebook is 1.44%, median CTR on Instagram is 0.67%
- Conversion rate on Facebook is 4.7%, conversion rate on Instagram is 3.1%
- Facebook Ads Manager has occasional issues with reliability
However, we went to great lengths to include more nuanced statistics, because prices, clicks and conversions can vary greatly based on your marketing objectives and industry. This is why we encourage you to study the data before you make the final decision on your advertising network.
All these statistics aside, you’re probably thinking – is there any way to maximize each of these metrics, no matter which social network I choose? Well, there is – there is a way to generate leads. For example, you can earn $10,000 on $50 in Facebook ad spend. You can also generate more than 1300 leads, each for $2.32. Want to learn whether you could do it too? Click below.