If you are planning to advertise on social networks, but you have a limited budget or specific target audience, Facebook vs Twitter may be one of the most challenging dilemmas you are facing.
There are plenty of great articles offering you in-depth analysis of various marketing strategies on Facebook and Twitter. However, there is so much to be told about each of them, and after a while the information becomes overwhelming.
At one point, this happened to me, as I researched some of the basic advertising stats for the world’s most popular social networks. Some of these stats, particularly those referring to Twitter, are surprisingly old or based on dubious samples.
Clicks and conversion rates tend to vary across different audiences and marketing objectives. That would be an easy conclusion. However, if you want a simple, straightforward breakdown of Facebook vs Twitter advertising power, we need to make sure we compare them on even grounds.
In this article, I will give you a basic, fair and square Facebook vs Twitter comparison – and I recommend you read it before you move on to detailed reviews of each network’s ad manager.
Facebook vs Twitter – Model
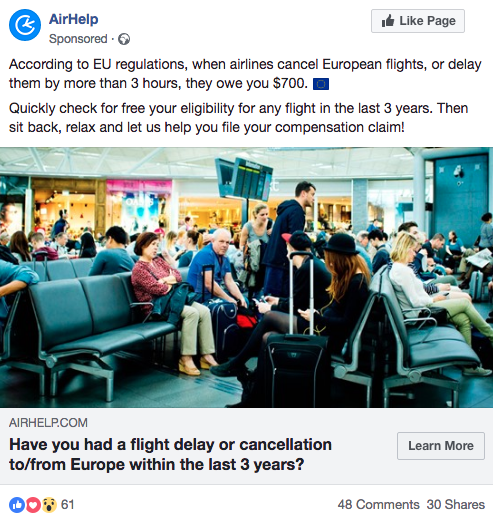
There are several types of ads you can run on Facebook, such as content and image ads, videos and image/video carousels. Facebook offers 13 ad placement options, including feed, right column, in-stream videos, marketplace, stories, and inbox. These messages are targeted toward specific audiences based on their demographics and interests.
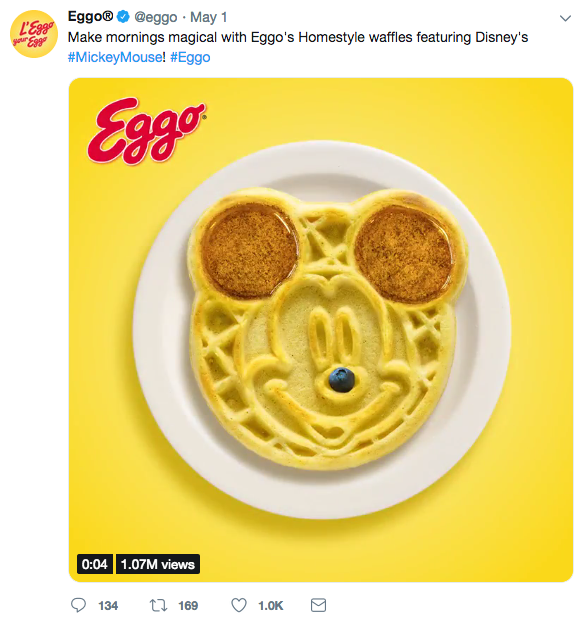
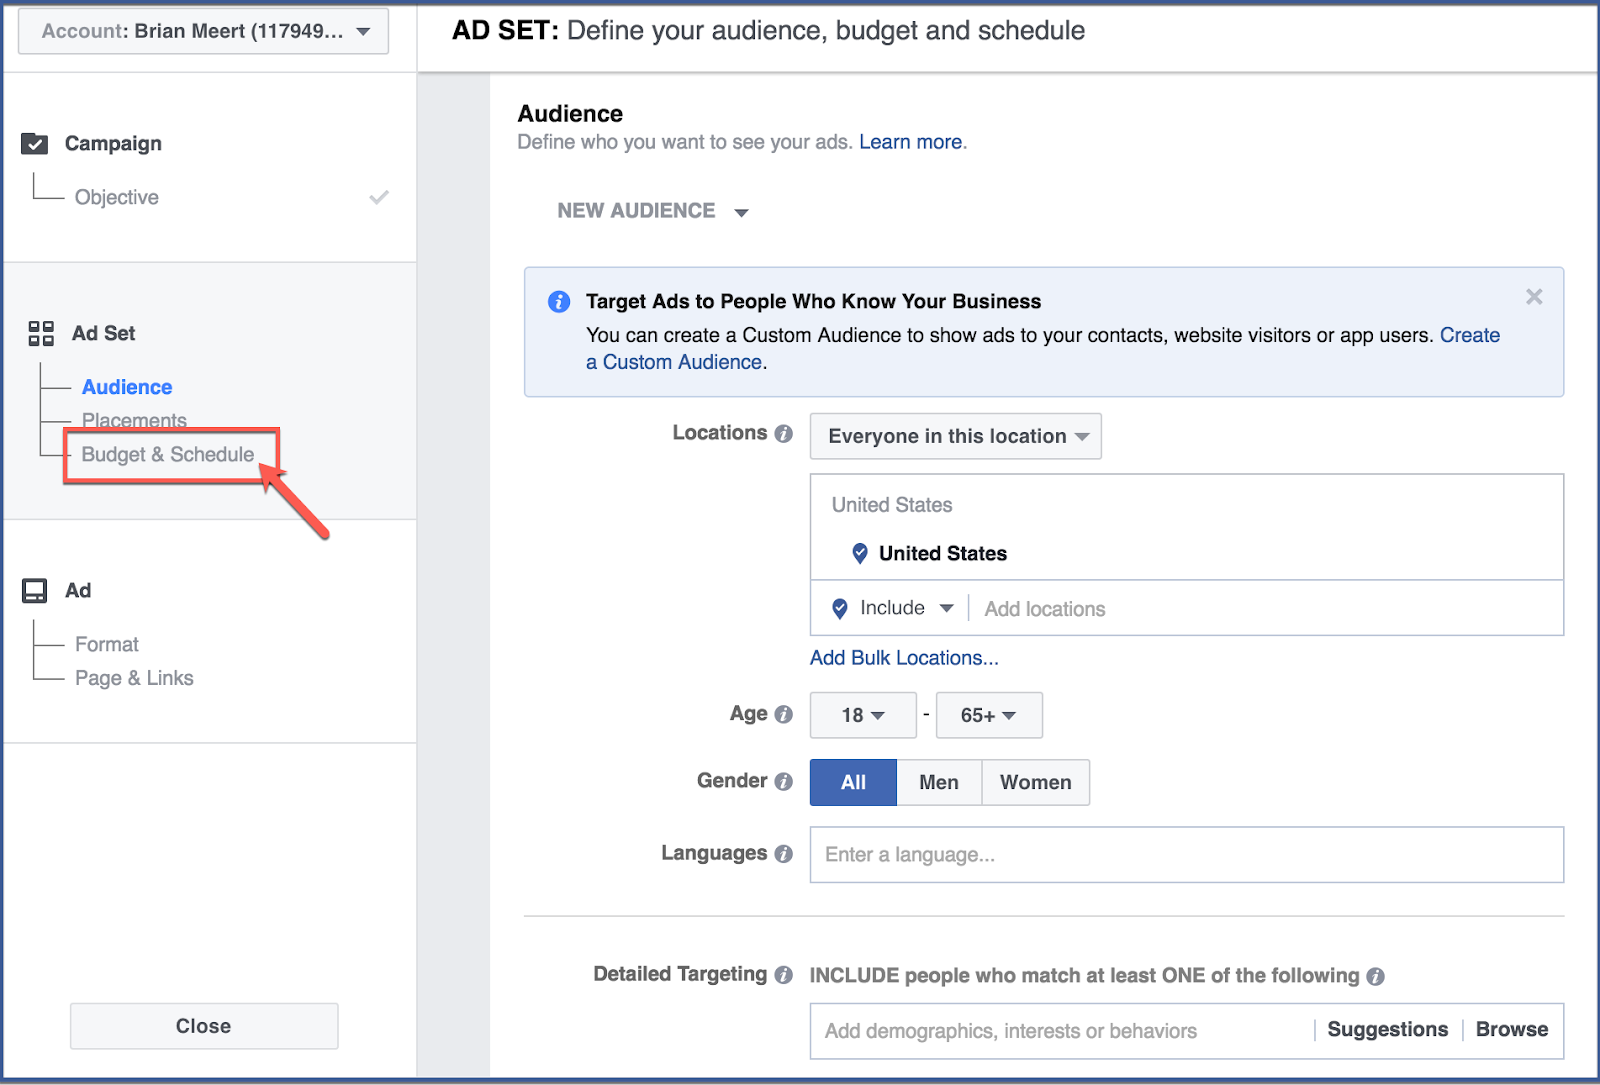
On Twitter, ads that look like ordinary tweets are placed on specific user profiles, timelines, search results for a promoted trend or at the top of search results for some queries. You can create your target audience based on users’ location, gender, language or device. The reach of your campaign is extended by targeting by specific keywords, their followers or interests.
Although Facebook and Twitter are different types of social networks, the way you target your audience is pretty similar and it offers a lot of flexibility. A basic marketing opportunity analysis and creating a buyer persona well be a solid foundation for a starter marketing campaign on each of those networks.
Before we move on to the numbers, pay close attention to the difference between average and median scores for pricing and clicks. The average result comes from adding up all the numbers and then dividing them by the number of numbers. The median is the middle value in the list of numbers (among 1,2,3,4,5, the median is 3). For final comparisons, I used the values that are available for both networks.
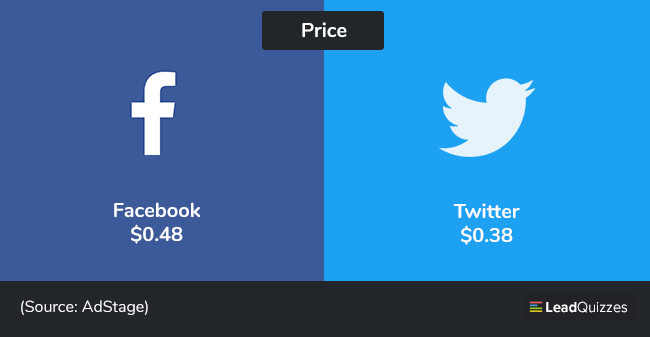
Facebook vs Twitter – Price
Put simply, Facebook Ads cost depends on the competition you get from other advertisers for the targeted audiences. Rule of the thumb is that the larger the audience, the higher the cost. The good thing is that Facebook offers several pricing structures based on ad types and advertising goals.
Facebook bidding is based on the amount of money you are willing to spend for a click, impression, view or app installation. The closer to sales conversion, the higher the cost – meaning that cost per click is going to be higher than the cost per impression.
The average cost per click with Facebook Ads is $1.86, but this varies greatly across the industries. If you calculate the median price, as AdStage did, it is $0.48 for placement ads.
Most businesses that advertise on Facebook choose the CPC models, although Facebook offers CPM (cost per mile – 1000 impressions) and CPA (cost per action) as well, both of which are more expensive and stand at $2.29 and $18.68 respectively.
Twitter ads pricing is determined by the allocated budget and bid for each campaign. You have three options: automatic, maximum and target bids. The automatic bid is determined by Twitter’s algorithm based on your campaign goal.
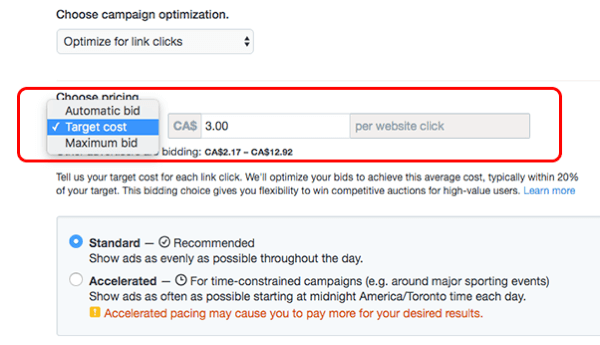
The maximum bid is set by the advertiser choosing the highest amount they would pay for a follow, click or interaction. If your goal is gaining followers or attracting clicks to your website, you can use target bid, selecting the amount you would pay for the desired action.
What you pay for depends on the type of your campaign:
- Website clicks campaign
- Follower campaign
- Tweet engagement campaign
- App install campaign
- Promoted video views campaign (counts as each video that was 100% downloaded on user’s device, played for 3 seconds or in full screen)
- Awareness campaign (based on the number of clients acquired in the campaign)
According to the analysis conducted on over 300 million Twitter ad impressions and more than 8 million clicks, the median CPM was $6.46. The median cost per click was $0.38.
Facebook vs Twitter – Paid Reach, Clicks and Conversions
Lower or higher price doesn’t make much sense if you are not going to reach enough people, or even worse, the right people. Of course, in modern marketing, it’s never about the sheer number – it’s always about the quality of your audience and leads. But let’s go step by step. Where is the party?
Reach
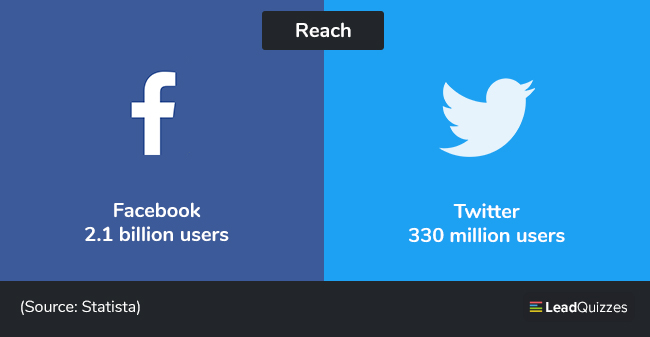
If we are talking about the numbers, the party is definitely in Facebook’s yard, with more than 2.1 billion members. Twitter, with its 330 million users is miles behind the world’s most popular social network.
Long story short, fewer people means less reach, often for the insignificantly smaller price. But, as we said, it’s not all about the numbers. How are audiences on Facebook and Twitter different?
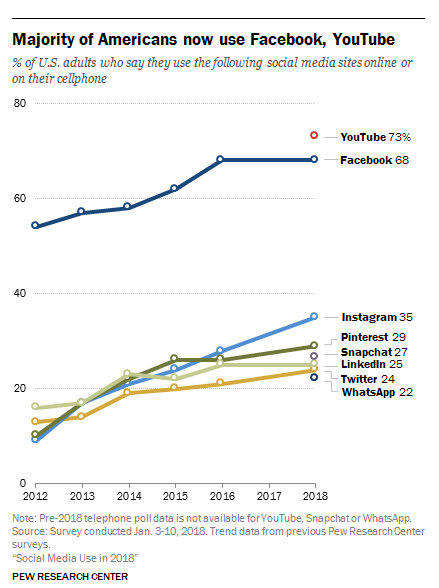
Around two-thirds of U.S. adults use Facebook, according to a survey conducted in January. Around eight-in-ten young people aged 18-29 use Facebook. The share of people older than 65 has doubled in the last 6 years and now stands at 41%, which is a significant number for anyone who wants to advertise on Facebook.
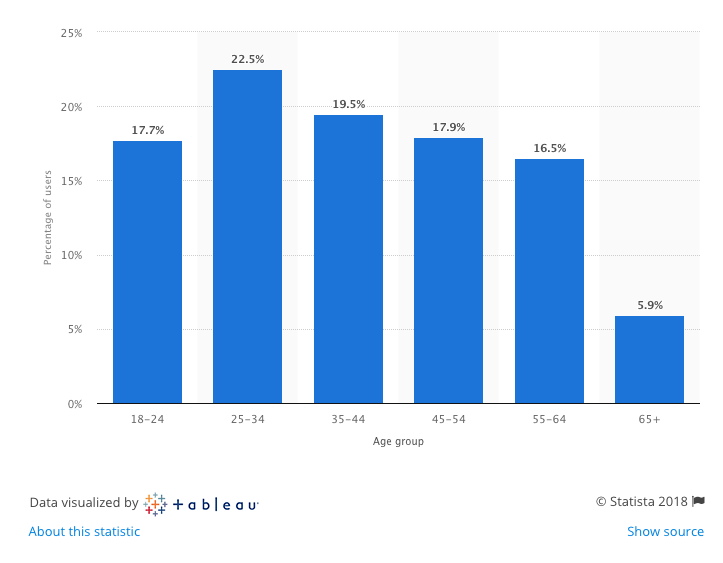
According to Statista’s research, as of December 2016, the majority of Twitter users (22.5%) were between 25 and 34 years old. The second-largest user group were aged 35-44, with a 19.5 percent share. Roughly a quarter of online adults in the United States are Twitter users.
Both networks are more likely to be used by urban audiences with a higher level of education and income. But, once again, Facebook wins when it comes to diversity of various demographic groups.
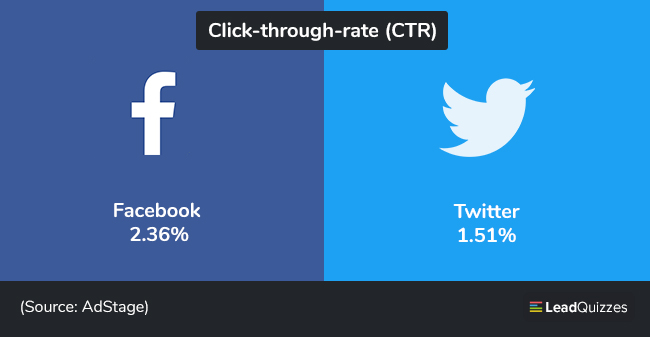
Click-through-rate (CTR)
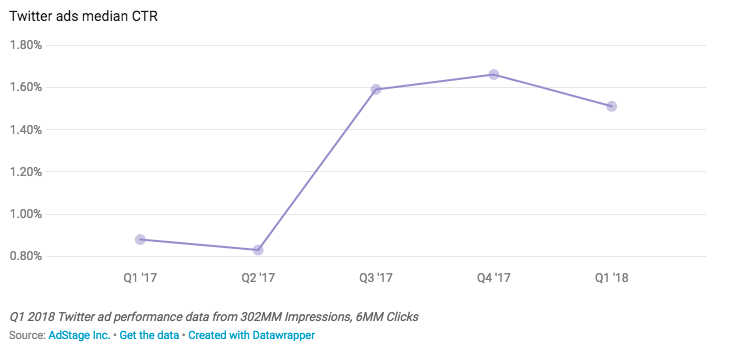
In early 2018, Twitter ads median CTR was 1.51%. Here is the graph showing Twitter’s highs and lows.
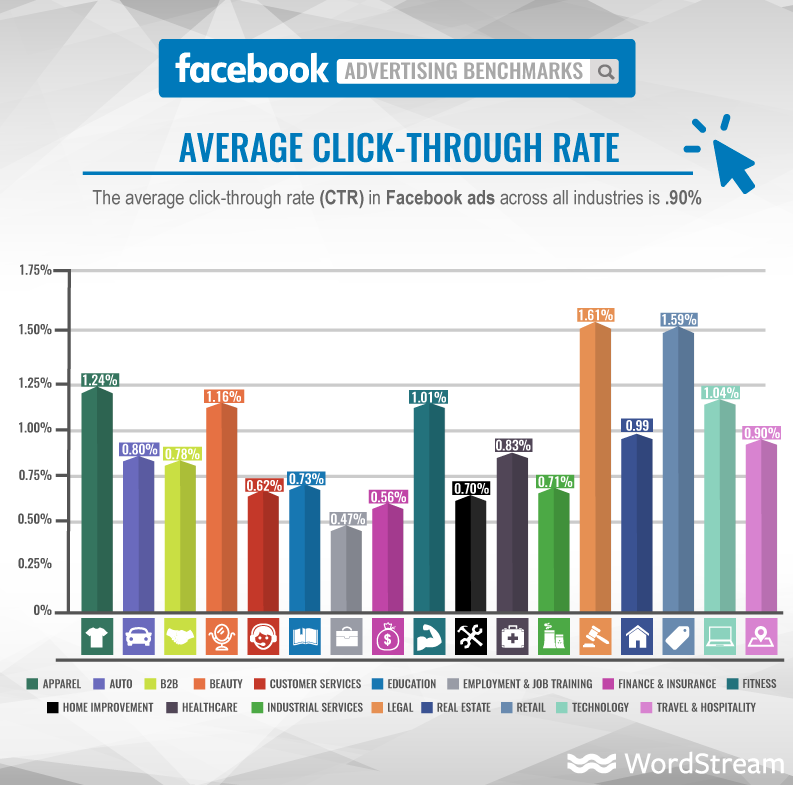
On Facebook, the average CTR across all industries is 0.90%, WordStream reported. Just like with pricing, this number varies greatly across the industries, but this information is at least available with Facebook, which isn’t the case with Twitter.
But there is more data. According to AdStage, median CTR for Facebook ads in early 2018 was 2.36% for news feed and right column ads, and 1.32% for audience network ads.
So, what is the conclusion when it comes to clicks? Let’s compare the median CTR calculated by the same source (AdStage) in the same time frame (2018, Q1). Since there are several types of Facebook ads, it is only fair to focus on those that are similar to Twitter ad placement, meaning news feed ads. In that calculation, Facebook comes ahead with the CTR 2,36% compared to Twitter’s $1.51.
Conversion rate
Ideally, all marketing roads lead to one destination – conversion. So, the best way to make the final conclusion about the Facebook vs Twitter showdown is neither reach nor click – it’s getting people to take action.
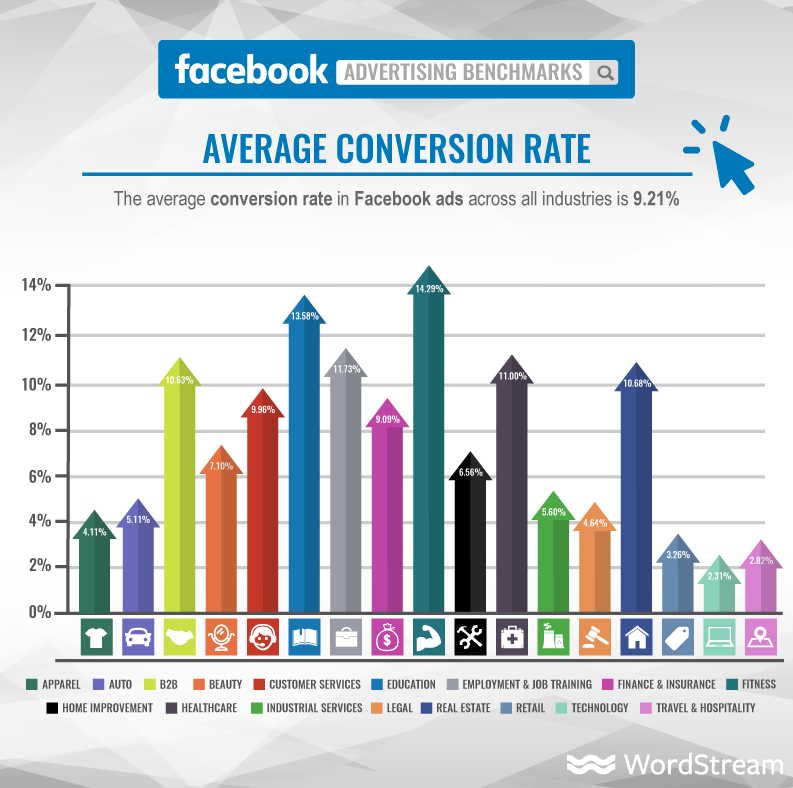
According to WordStream, the average conversion rate for Facebook ads is 9.21%, which is a solid number.
Twitter is a bit tricky because they are not nearly as open as Facebook when it comes to the success of their advertising. For example, a top ranking Google result for Twitter conversion rate dates back to staggering 2011, so the information seems pretty irrelevant.
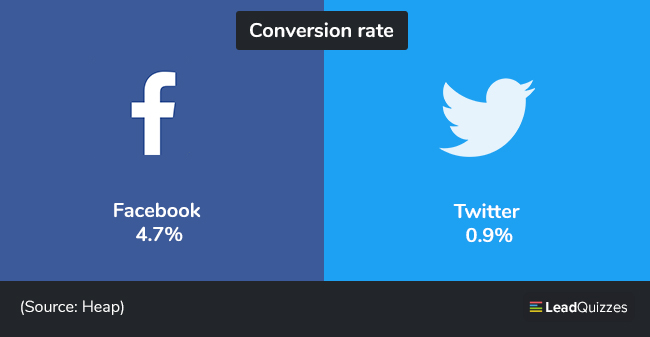
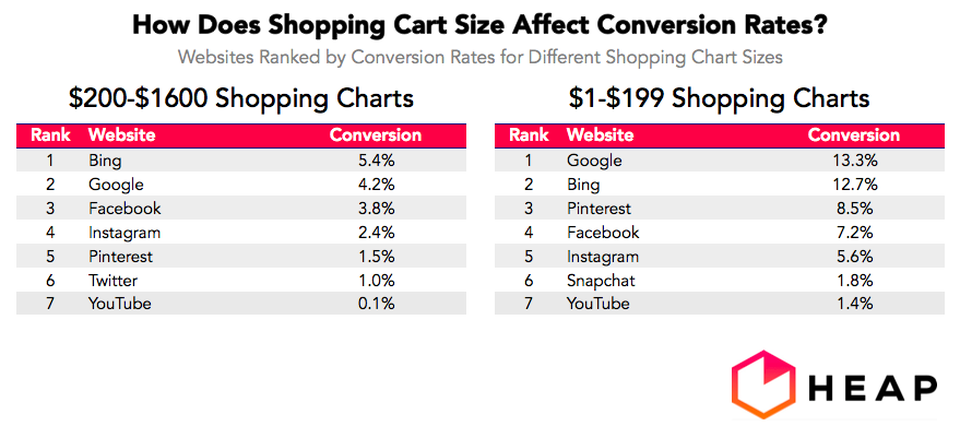
However, there is some fresh information if you dig deeper. An analytics company Heap conducted a customer acquisition research on several social networks and search engines. They came to the conclusion that Google and Bing had the highest customer conversion rates, at around 8%.
Facebook conversion rate was 4.7%, leaving Twitter with 0.9% far behind. But Heap went a little deeper, trying to figure out how conversion rates vary based on shopping cart size. In general, smaller shopping carts ($1-$199) have larger conversion rates. According to Heap, they went up to 13.3%, while large shopping carts had conversion rates up to 5.4%. This is how Facebook and Twitter fared on both fronts.
Facebook vs Twitter – Reliability
Another point of comparison I wanted to take into account was the ad manager reliability. This is incredibly important if you are running time-limited, quick campaigns that require you to be at the top of your game and updated on hourly basis.
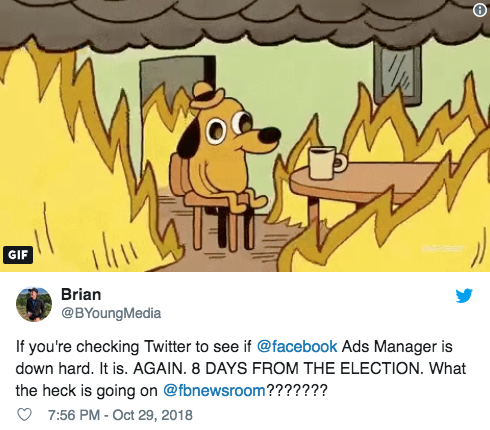
This is the case with marketers who use Facebook or Twitter for political advertising – and Facebook has been increasingly frustrating for them. In late October, Facebook Ads Manager was down for 8 hours, a week ahead of midterm elections, prompting the marketers to use Twitter and Google to squeeze out the data they desperately needed.
As they told Digiday, this was not the first time Facebook left them hanging.
“Facebook is an increasingly frustrating experience for ad buyers. The site goes down, auctions are inconsistent and hitting ‘publish’ can be a crapshoot,” said Betsy Hindman, a digital marketer for business-to-business clients. “Surprisingly wonky for such a powerhouse.”
Of course, all ad platforms have some issues, but compared to Facebook, there has been less trouble on Twitter.
Facebook vs Twitter – Final verdict
The end result is clear – if you are operating with a limited budget, you will have better results on Facebook for an insignificantly higher price. Facebook boasts a larger audience, better click-through-rate, and more successful conversions, despite occasional shortcomings of its ad manager.
Despite all of this, according to HubSpot, social media marketing is among the most overrated marketing practices. It is not a surprise, given that many marketers use these stats and numbers as a guarantee that their advertising is going to yield results. However, quite a few of them fail at engaging their desired audiences – but that goes beyond Facebook vs Twitter comparison.
If you want to see the results, you need to understand the specifics of the network you opt for. If your choice is Facebook, you are in the right place. Have you heard that 8 out of 10 people will click on a quiz they see on their News Feed?
If your immediate thought is that the quiz could become your click and convert machine, you’re on the right track, so click the button below to learn how to surpass the numbers you’ve seen in this article.